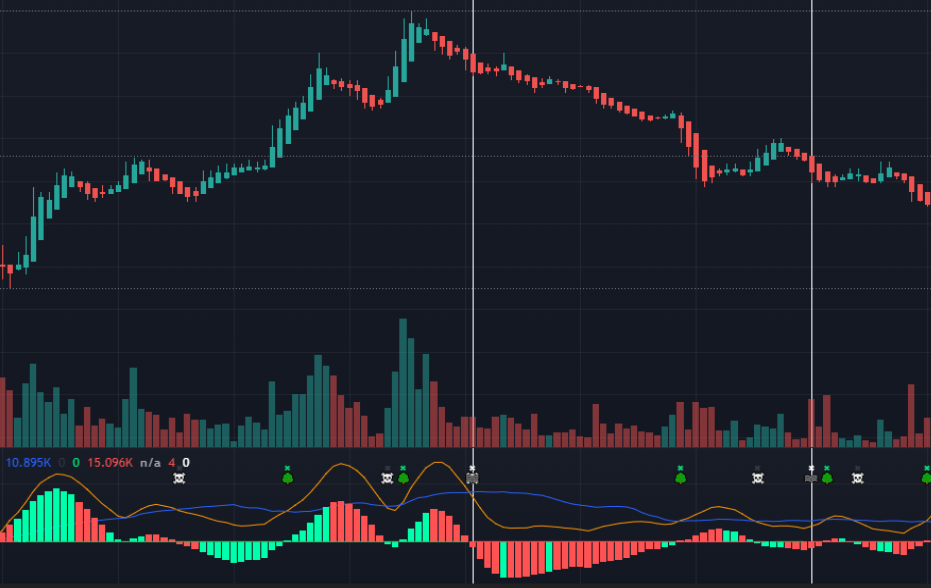
Description: Do you struggle with Overtrading? This Indicator provides a visual graph identifying the current Volatility of the chart. It provides clues and signals telling you when it's time to stop trading whatever ticker it is you're looking at and move along. Will also identify Fade opportunities on stocks.
Tips: Don’t trade in areas considered Low Volatility, be wary of incoming chop if the Histogram is heading downwards or sideways. If you like to trade Large Caps or Indices, use the Daily chart to be informed that a specific intraday may be “Choppier” than typical days.
Recommended Timeframes: 1min, 5min, 15min, 1hour, 4hour, Daily